Enhanced AI Crawl Control metrics with new drilldowns and filters
AI Crawl Control now provides enhanced metrics and CSV data exports to help you better understand AI crawler activity across your sites.
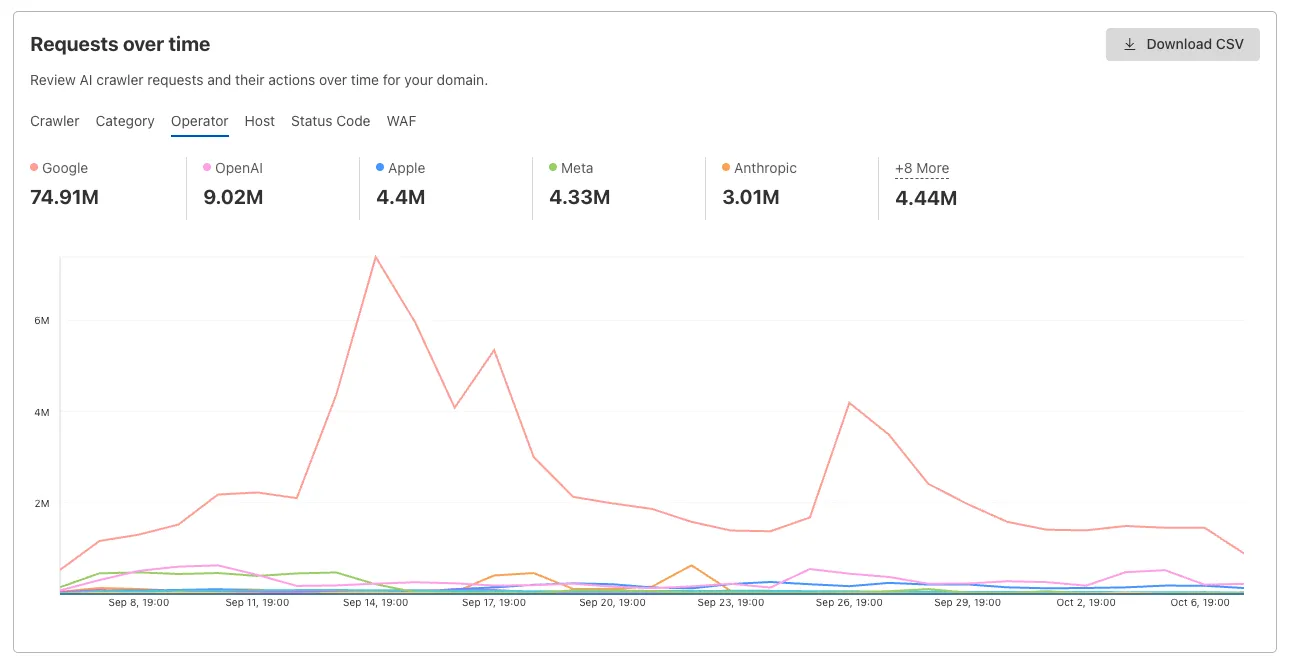
Visualize crawler activity patterns over time, and group data by different dimensions:
- By Crawler — Track activity from individual AI crawlers (GPTBot, ClaudeBot, Bytespider)
- By Category — Analyze crawler purpose or type
- By Operator — Discover which companies (OpenAI, Anthropic, ByteDance) are crawling your site
- By Host — Break down activity across multiple subdomains
- By Status Code — Monitor HTTP response codes to crawlers (200s, 300s, 400s, 500s)

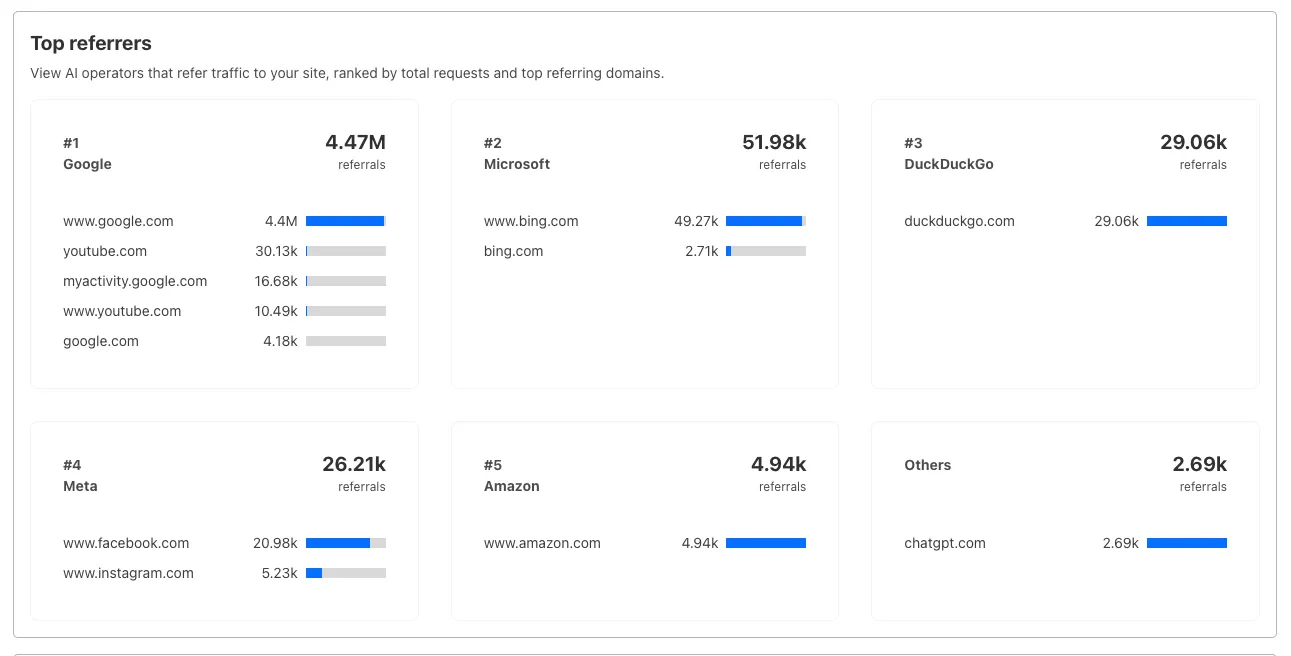
Identify traffic sources with referrer analytics:
- View top referrers driving traffic to your site
- Understand discovery patterns and content popularity from AI operators

Download your filtered view as a CSV:
- Includes all applied filters and groupings
- Useful for custom reporting and deeper analysis
- Log in to the Cloudflare dashboard, and select your account and domain.
- Go to AI Crawl Control > Metrics.
- Use the grouping tabs to explore different views of your data.
- Apply filters to focus on specific crawlers, time ranges, or response codes.
- Select Download CSV to export your filtered data for further analysis.
Learn more about AI Crawl Control.
Was this helpful?
- Resources
- API
- New to Cloudflare?
- Directory
- Sponsorships
- Open Source
- Support
- Help Center
- System Status
- Compliance
- GDPR
- Company
- cloudflare.com
- Our team
- Careers
- © 2025 Cloudflare, Inc.
- Privacy Policy
- Terms of Use
- Report Security Issues
- Trademark
-