Status code metrics in Cloudflare Site Analytics
Overview
Status Codes metrics in the Cloudflare dashboard Analytics app provide customers with a deeper insight into the distribution of errors that are occurring on their website per data center. A data center facility where Cloudflare runs its servers that make up our edge network. You can find a list of all of Cloudflare data centers here.
HTTP status codes that appear in a response passing through our edge are displayed in analytics. These codes can be split into three groups: ‘edge network errors’, ‘origin errors’ and ‘52x errors’.
Errors that originate from our edge servers -such as 502, 503, and 504 with ‘Cloudflare’- are not reported as part of the error analytics. However, errors such as 52x, can inform you about problems with your server.

Edge Network errors
- 400 - Bad Request intercepted at the Cloudflare Edge (e.g. missing or bad HTTP header)
- 403* - Security functionality (e.g. Web Application Firewall, Browser Integrity Check, Cloudflare challenges, and most 1xxx error codes)
- 409* - DNS errors typically in the form of 1000 or 1001 error code
- 413 - File size upload exceeded the maximum size allowed (configured under the Speed app)
- 444 - Used by Nginx to indicate that the server has returned no information to the client, and closed the connection. This error code is internal to Nginx and is not returned to the client.
- 499 - Used by Nginx to indicate when a connection has been closed by the client while the server is still processing its request, making the server unable to send a status code back.
Origin errors
- 400 - Origin rejected the request due to bad, or unsupported syntax sent by the application.
- 404 - Only if the origin triggered a 404 response for a request.
- 4xx
- 50x
503 errors
We do count 503 errors from your origin that are passed as a response from the edge, though in this version 503 errors from the edge have multiple potential sources.
- Your origin server had a 503. We received this from the origin and the status code was in the response from the on the edge
- Websocket rate-limit error
52x errors
- 520 - This is essentially a “catch-all” response for when the origin server returns something unexpected, or something that is not tolerated/cannot be interpreted by our edge (i.e. protocol violation or empty response).
- 522 - Our edge could not establish a TCP connection to the origin server.
- 523 - Origin server is unreachable (e.g. the origin IP changed but DNS was not updated, or due to network issues between our edge and the origin).
- 524 - Our edge established a TCP connection, but the origin did not reply with a HTTP response before the connection timed out.
Status codes
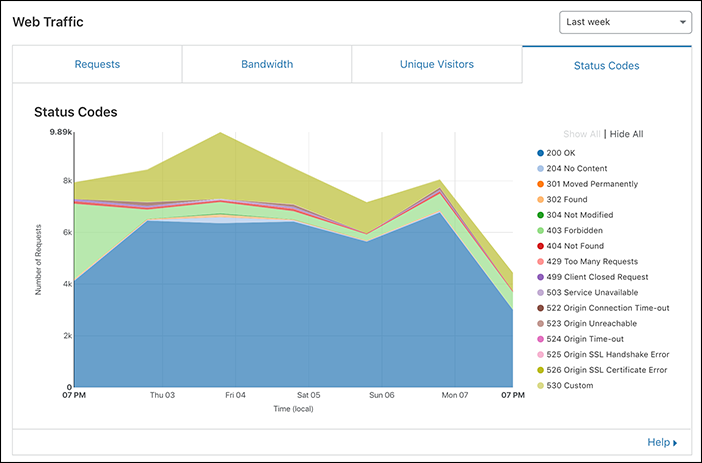
The status codes section shows:
- The error code returned in the response
- The time-stamp for the “bucket” you selected
- The total count of that specific error code for that time-stamp
- The % of total requests that serves that error
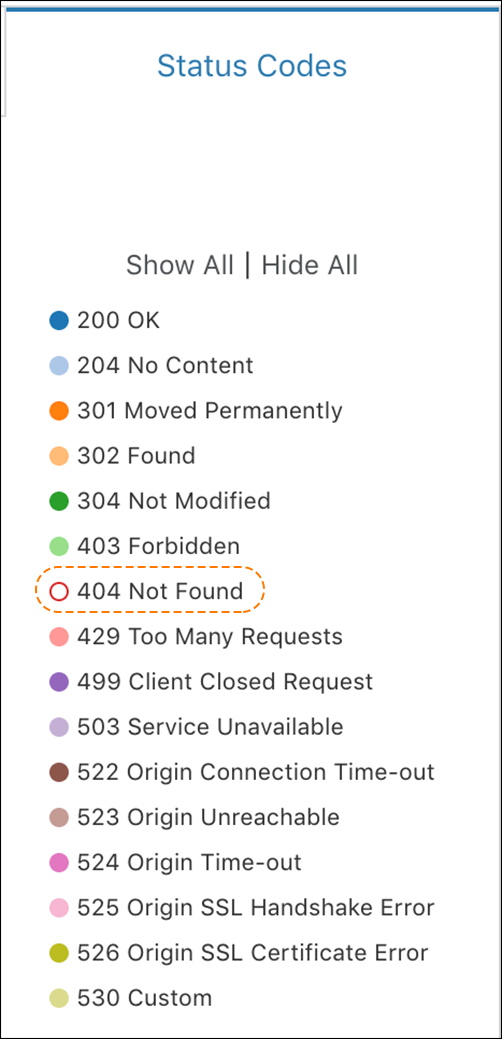
You can filter out specific error(s) by selecting one or more in the legend. Once you select an error it will be greyed out in the drop-down menu, and the error will no longer display as part of the graph.

In this example, by clicking on “404” in the legend we removed it from being displayed in the UI.