Understanding Cloudflare Account Analytics (beta)
Overview
The Cloudflare dashboard (Account) Analytics app is a major component of the overall Cloudflare analytics product line. Specifically, you can access a wide range of aggregated metrics from all the sites under a specific Cloudflare account.
View your account analytics
To view metrics for your site:
1. Log in to the Cloudflare dashboard.
2. Select the appropriate Cloudflare account.
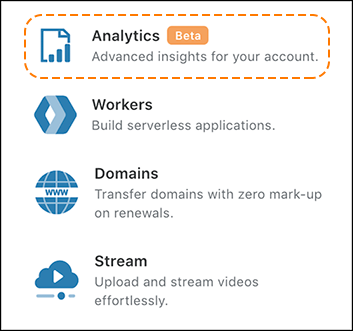
3. Under the Home tab, click Analytics to the right of the list of sites.
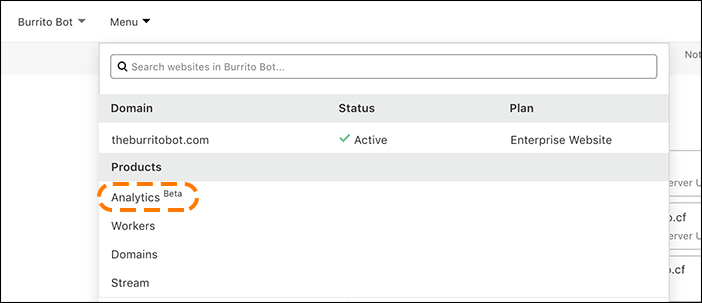
Alternatively under Menu, locate the Products section and select Analytics.
Once it loads, the Account Analytics app displays a collection of categorized charts with aggregated metrics for your account. To understand the various metrics available, refer to Review your account metrics below.
Review your account metrics
This section outlines the aggregated metrics under each category. Before reviewing your metrics, let’s define a couple of concepts used in some panels:
- Rate - Reflects the ratio between the amount for a specific data category and the total.
- Bandwidth - Refers to the number of bytes sent from the Cloudflare edge network to the requesting client.
Also, note that:
- To filter metrics for a specific time period, use the dropdown in the top right.
- Most metrics are grouped into panels representing different aspects of the underlying data.
Summary of metrics
Below is a brief description of the major elements comprising the metrics available.
HTTP Traffic
These charts aggregate data for HTTP traffic, and include:
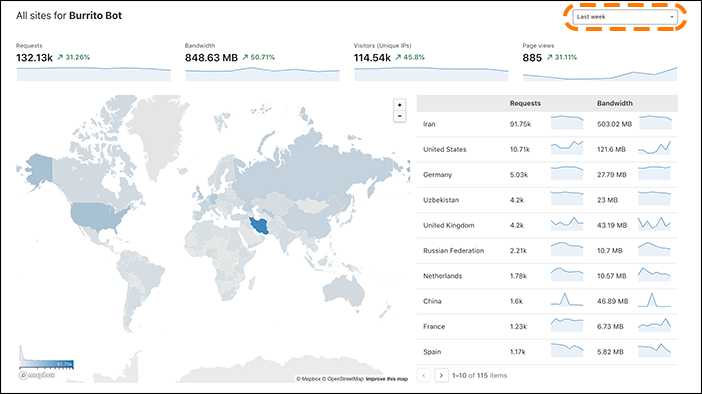
- Spark lines for Requests, Bandwidth, Page views, and Visitors (Unique IPs)
- An interactive map that breaks down the number of requests by country
- A table combining numerical and spark line data, sorted by total number of requests per country
Security
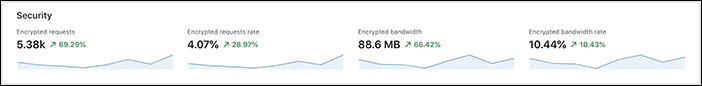
This panel features spark lines highlighting various encryption metrics, including: requests, requests rate, bandwidth, and bandwidth rate. These also include a comparative percentage change based on the previous period.
Cache
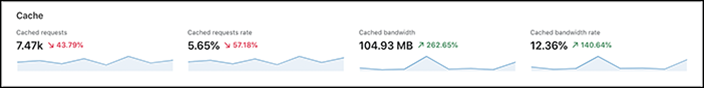
This panel features spark lines for various caching metrics, including: requests, requests rate, bandwidth, and bandwidth rate. These also include a comparative percentage change based on the previous equivalent period. For example, if you selected Last week as your time period, the previous period refers to the week before.
Errors
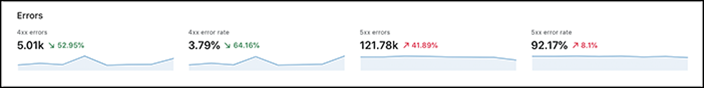
This panel displays spark lines for 4xx and 5xx error rates, respectively. Learn more about HTTP Status Codes.
Network
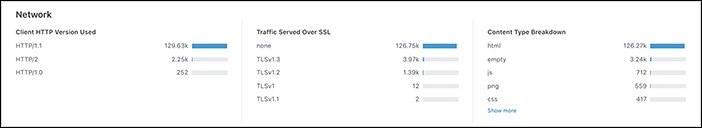
Client HTTP Version Used
These statistics show the percentage of requests that use a specific version of HTTP.
Traffic Served Over SSL
These statistics show the percentage of traffic that is encrypted using a specific version of SSL or TLS.
Content Type Breakdown
These statistics show the number of requests based on the resource content type.